Docker container Java heap dump analysis
by
Soon after installing a monitor on the service that takes data real time, I got an message saying that the service was not gathering any data. I checked and the container was running but the logs showed that it was not having any activity. The output of docker stats showed that the container had a significant grow in size. It probably run out of memory so I just restarted it and everything was back to normal again.
I was wondering what could have made the data gathering process grow so much in memory and lead to the collapse so I tried to obtain a heap dump of the running container.
Theoretically you can run jmap on a remote Java process if you start the process with the following options:
	JAVA_OPTS='
		-Djava.rmi.server.hostname=<host>
		-Dcom.sun.management.jmxremote
		-Dcom.sun.management.jmxremote.port=<port>
		-Dcom.sun.management.jmxremote.rmi.port=<port>
		-Dcom.sun.management.jmxremote.local.only=false
		-Dcom.sun.management.jmxremote.authenticate=false
		-Dcom.sun.management.jmxremote.ssl=false'
and then execute something like this:
jmap -dump:format=b,file=/tmp/test-dump.hprof <host>:<port>
The first lines of code just tell the java virtual machine to open an RMI port to allow debugging, which jmap uses to get the heap dump.
When using this in the context of Docker there are some things to take into account. You can send the JAVA_OPTS parameter via -e on the docker run command, but you have to remember to map the port with -p port:port in order to be able to connect. Well, obviously this is not the only one because I couldn’t get this working.
What I did instead is to bundle the JDK in the docker image so I could execute jmap in the container locally. But then I found that jmap is not happy with Alpine, the lightweight distribution my docker image uses. So I installed a JDK and stopped using Alpine.
After that I enjoyed the possibility of running the heap dump:
docker exec -it data-gatherer jmap -dump:format=b,file=/tmp/test-dump.hprof 1
And analyze it with, for example, jvisualvm, which comes with the Oracle JDK. There is also MAT.
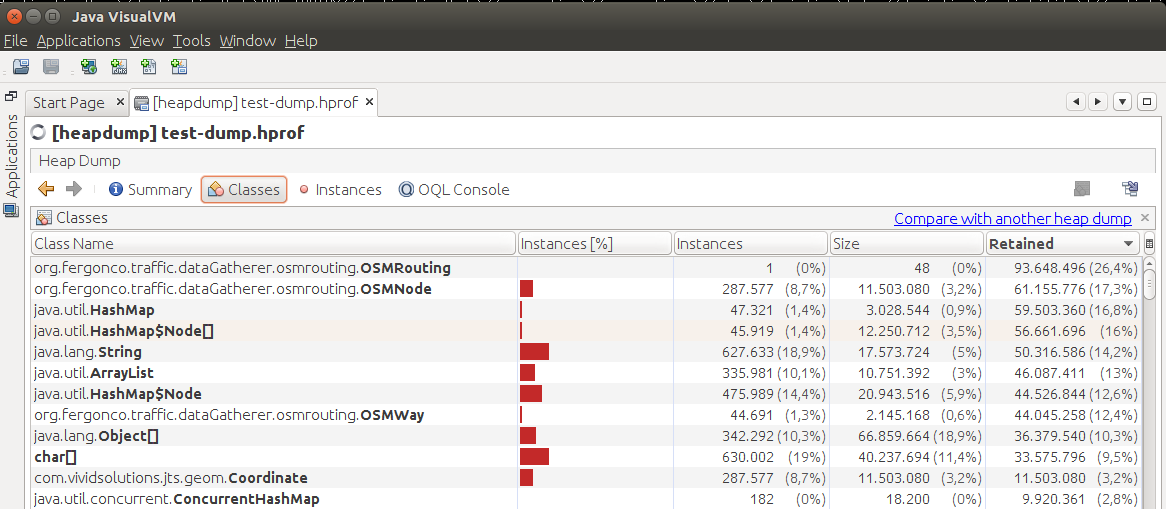
And well, the screenshot just shows how a custom OpenStreetMap route planner is taking a lot of memory, but this is normal and I already knew. The fact is that since then, it never died again and the heap dumps show no apparent problem.
So let’s hope the problem does not come back… but if it does I will be prepared!
tags: