In the previous post I set the context of a project to monitor and predict the traffic over the border passages between Pays de Gex and Geneva. You can see it online here: http://fergonco.org/border-rampage/.
As one can see in the next data flow diagram, the project basically consists on gathering data from Geneva public transport (TPG) APIs, modelling the data, producing forecasts and drawing all this in a map:
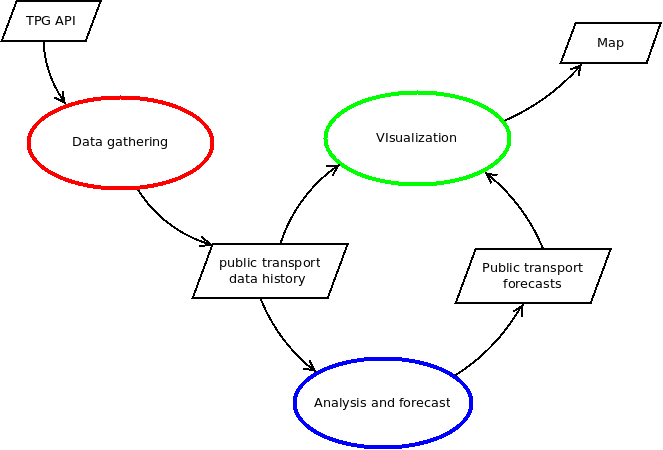
In this post I will describe the process of gathering the data (in red).
Data gathering process
As I said, Geneva public transport system, TPG, offers a REST API that allows querying the arrival time from their vehicles to each stop. Basically I am using two calls: GetAllNextDepartures and GetThermometer. The first one returns all the departures that take place from a specific stop to a specific destination. For example, this call:
http://prod.ivtr-od.tpg.ch/v1/GetAllNextDepartures.xml?
	stopCode=VATH&lineCode=Y&destinationCode=FERNEY-VOLTAIRE
will return all the departures of the line “Y” from Val-Thoiry (VATH) to Ferney-Voltaire:
<?xml version="1.0" encoding="UTF-8"?>
<nextDepartures>
<timestamp>2017-08-05T11:09:23+0200</timestamp>
<departures>
<departure>
<departureCode>143732</departureCode>
<timestamp>2017-08-05T16:24:23+0200</timestamp>
<waitingTimeMillis>18940000</waitingTimeMillis>
<waitingTime>&gt;1h</waitingTime>
<reliability>T</reliability>
</departure>
<departure>
<departureCode>143906</departureCode>
<timestamp>2017-08-05T17:09:23+0200</timestamp>
<waitingTimeMillis>21640000</waitingTimeMillis>
<waitingTime>&gt;1h</waitingTime>
<reliability>T</reliability>
</departure>
...
</departures>
</nextDepartures>
The second call, GetThermometer, gives you the “thermometer” of one particular departureCode, which contains the expected arrival time of the vehicle to each stop (or the actual arrival time if the vehicle was already there):
<?xml version="1.0" encoding="UTF-8"?>
<thermometer>
   <timestamp>2017-08-05T11:23:49+0200</timestamp>
   <lineCode>Y</lineCode>
   <destinationName>Ferney-Voltaire</destinationName>
   <destinationCode>FERNEY-VOLTAIRE</destinationCode>
   <steps>
	  <step>
		 <departureCode>143732</departureCode>
		 <timestamp>2017-08-05T16:25:00+0200</timestamp>
		 <stop>
			<stopCode>VATH</stopCode>
			<stopName>Val-Thoiry</stopName>
		 </stop>
		 <deviation>false</deviation>
		 <reliability>T</reliability>
		 <arrivalTime>301</arrivalTime>
		 <visible>true</visible>
	  </step>
	  <step>
		 <departureCode>143733</departureCode>
		 <timestamp>2017-08-05T16:27:56+0200</timestamp>
		 <stop>
			<stopCode>THGA</stopCode>
			<stopName>Thoiry-Gare</stopName>
		 </stop>
		 <deviation>false</deviation>
		 <reliability>T</reliability>
		 <arrivalTime>304</arrivalTime>
		 <visible>true</visible>
	  </step>
	  <step>
		 <departureCode>143734</departureCode>
		 <timestamp>2017-08-05T16:29:20+0200</timestamp>
		 <stop>
			<stopCode>THMA</stopCode>
			<stopName>Thoiry-Mairie</stopName>
		 </stop>
		 <deviation>false</deviation>
		 <reliability>T</reliability>
		 <arrivalTime>305</arrivalTime>
		 <visible>true</visible>
	  </step>
	  ...
   </steps>
</thermometer>
In order to obtain the arrival time of the vehicles to the stops, a process makes use of these calls in the following way:
- Before the first service starts, at 4am, the process calls GetAllNextDepartures for the starting stops of all the three lines being monitored and stores the codes from all vehicles servicing the lines during that day.
- For all vehicles servicing a line, the process issues a call to GetThermometer and registers the expected arrival times to every stop.
- The process sleeps if no arrival is expected in the next five minutes. This happens only at the beginning and end of the day because during the day arrivals take place constantly. But it allows to spare some calls to the API.
- Few minutes before the next arrival is expected, the process wakes up and queries the relevant GetThermometer to check if the expected arrival time is now. When it is, the process registers the arrival of the vehicle and updates the database.
- Repeat from 3.
Problems found
Monitoring
This process was designed to be run indefinitely on the server. But of course the process would definitely crash at some point. How could I avoid taking a look at it every morning and, nevertheless, be sure it is working properly?
I used Monit to monitor the service. It allows to check different aspects of your system (process running, disk space, service output, etc.) and receive mail alerts when some conditions are met. With Monit it was a matter of minutes to setup an alert to be triggered if the service was not running.
But I didn’t want to check only that the service was running. I wanted to be sure the service was running and gathering data properly. The details are explained in a previous post.
This proved very useful to detect that the service was running but collapsed due to a memory leak, that databases can run out of space (see next) and that APIs can fail (see further down).
Disk full
I had two episodes of this problem.
On the first one, due to a careless design of the database, I was storing more data than necessary each time a vehicle arrived to a stop. Which happens very frequently.
On the second one I just forgot the debug logs on, which are very verbose each time a vehicle arrives to a stop. So in few days the process filled up several Gigabytes. As a quick workaround I learned that it is possible to roll the log file in Docker with these options:
--log-opt max-size=50m --log-opt max-file=7
Evolving database design
As said previously, the first design of the database was done without care. It was a first draft in a project that I thought was not going very far. At the end it did. And it was a huge mistake not to fix the database design at the earliest.
There were more than eight million records with redundant information. Due to the full disk episodes they were spread in three database backups, some of them overlapping.
When forecasting proved impossible with this data model it took me around ten days to unify the old backups and migrate them to the new, better model.
Storing processed data instead of measured data
I wanted to draw the map based on the speed of the vehicles between stops. By querying the TPG API I could know when the vehicles arrive, which along with the length of the route between stops would allow to calculate speed. And speed is what I stored in the database.
Then I realized that the routes between some stops where wrong, and so where the speeds calculated between those stops. To correct the speeds I had to undo the speed calculation using the wrong route lengths, obtain the time between stops and calculate the speed again with the right route length. Very entertaining.
Then I realized that there were speeds equal to 3402km/h !! What happened? Probably some wrong data coming from the API or detecting the vehicle arrival. But, as I am processing the data before I save it on the database I cannot easily know the reason.
The current database design does not store speeds anymore, just the time between stops. The speed is calculated later, when the data is processed for visualization or for analysis, where I can use the route lengths that I know are true at the moment.
TPG API fails
One day the data gathering service monitor alerted of data not being gathered. I saw in the logs that the request at 4am, when the process gets the planned schedule, had failed because the answer contained an empty response. I copy&pasted the request URL on the browser and I got an empty response again. At first I thought there was a problem with my API key. A bit later I tried again and it worked. Probably a temporal ban? Then it worked, then it didn’t. And so on without a recognizable pattern.
Then I run a script with 100 calls which yielded a ~50% success ratio. So basically the service was failing 50% of the time. Why? My hypothesis is that there was a load balancer with two machines behind, one of them being broken.
So I changed the API layer to retry N times before raising the failure to upper layers. Now the question was: Which N to choose?
The probability to get a failure in one call is 0.5. Two failures in a row 0.5*0.5=0.25 and so on. So if I want a failure to happen a 0.1% of the times I should find N so that:
0.5^n = 0.001
which I solve thus:
log(0.5^n) = log(0.001)
n * log(0.5) = log(0.001)
n = log(0.001)/log(0.5)
n = 9.97
So retrying 10 times should get over the 50% API failure rate 99.9% of the times.
Lessons learned
Despite of all these problems I think it was ok. Being a service that had to run constantly it could have turned into a nightmare but it didn’t. However I learnt some things:
- Monitor your service. Monitor that the service is doing its work.
- Design your database properly from the beginning. Specially if you are gathering a lot of data.
- Therefore, estimate how much data are you gathering.
- Will the disk be full? Monitor the free space in disk and have a plan to free space. You may want to roll your log files.
- Put the data in the database as it is measured, without processing, and move all processing to a later phase. This will allow debugging the input data more easily.
- APIs may fail in many ways: quota exceeded, service down, service down randomly, etc. Take that into account to make your process as resilient as possible.