Docker container Java heap dump analysis (follow up)
by
In the last entry I showed how a docker container that is gathering data was having memory problems. The problem was occurring again and again so I finally I ended up running the docker container with the -XX:+HeapDumpOnOutOfMemoryError JVM parameter in order to get a dump when an OutOfMemoryError occurs. I did that using the JAVA_OPTS environment variable, passed to the docker container with the -e parameter:
-e JAVA_OPTS='-XX:+HeapDumpOnOutOfMemoryError -XX:HeapDumpPath=/path/where/the/dump/is/generated'
Finally the error occurred and I got the dump.
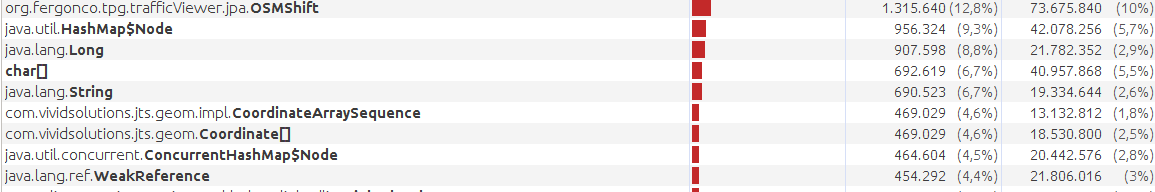
As last time, I analyzed it with jvisualvm. The dump was big and I could not generate the retained sizes shown in the previous post image, but it was not necessary. I observed very quickly that there where more than one million instances of a JPA class (OSMShift), which are the objects I create to populate the database when an event is detected.
Theoretically I build these objects based on events I detect with the real time APIs, then I send them to the database and that’s it: I don’t need these objects anymore and I don’t hold direct references to them. So it is obvious someone else is doing it: The EntityManager.
EntityManagers are supposed to be short lived, so the utility method that gives the EntityManager generates a new instance in every call, not catching it.
But I had a listener class that was keeping the EntityManager as a field.
I fixed it and the problem seems to be solved. Anyways I keep the -XX:+HeapDumpOnOutOfMemoryError option on the docker container… and I may do it systematically for all Java related containers.
Some conclusions:
- It is interesting to keep memory problems in mind when dividing your application into services: This memory problem was easy to solve partly because the service is very small and does just one thing. I moved this service to a separated image in order to not interrupt the data gathering when deploying other components of the system but obviously this helped also to diagnose the memory problem.
- Unit tests may be counterproductive. This will be the subject for another post. Basically they are coupled with your code, increasing the maintenance costs. And here they forced me to change my code in order to unit test it, creating accidentally this memory leak. From now on my heuristics to test will drift to giving more importance to functional tests and only unit test the code that may be specially sensitive or bug prone.